Posts tagged ‘Income’

September 10, 2013

Toronto District School Board census 2011: Unsettling picture of inequality revealed

English: Park School studentsClose to 90,000 parents, or sixty-five per cent, of elementary school parents answered the Toronto District School Board’s census sent home last fall. The results are coming out now and reveal the unequal opportunities which children of different family backgrounds enjoy. A recent TDSB research report presents a startling picture of class and racial inequality among our youngest city residents.

 As part of gaining a snapshot of its students, parents were asked to report their family’s total income. Divided into five income groups for comparison, the report shows
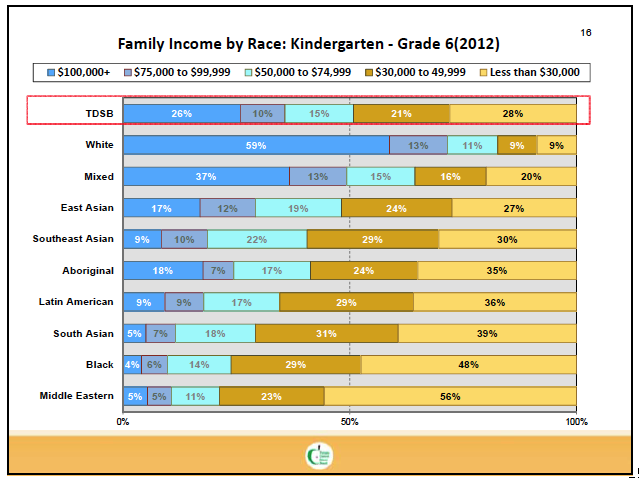
  • 28% families reported a family income of less than $30,000/year.
  • 21% reported $30,000 – $49,999/year.
  • 15% reported $50,000 – $74,999/year.
  • 10% reported $75,000 – $99,999/year.
  • 26% reported $100,000+.

When this data was broken down by each family’s racial background, the differences became even more unsettling:

Bar graph showing self-reported family income of school board students by racial background.

TDSB research report on 2011 census of parents with children in Kindergarten through Grade Six.

The impact of these different family income levels was also reflected, as would be expected, in the out-of-school experience of children. Parents in each income group were asked about their children’s extra-curricular and pre-school activities.

Consistently, income was tied to children’s experiences outside of school. The following presents some of these marked differences. (Although the Board’s analysis covers all five income groups, figures for the lowest, middle and highest income groups are reported here as the pattern remains the same across each category.)

Child care centre (before Kindergarten)

  • 25% children in lowest income families enrolled their child in a child care centre.
  • 29% children in the middle-income families enrolled their child in a child care centre.
  • 45% children in highest income families enrolled their child in a child care centre.

Pre-school program

  • 25% children in lowest income families attended a pre-school program.
  • 34% children in the middle-income families attended a pre-school program.
  • 56% children in highest income families attended a pre-school program.

Sense of safety on their street or in their neighbourhood

  • 80% parents in lowest income group said their child is safe on their street or in their neighbourhood.
  • 90% parents in the middle-income group said their child is safe on their street or in their neighbourhood.
  • 95% parents in highest income group said their child is safe on their street or in their neighbourhood.

Sports & Recreation

  • 64/% children in the highest income families are involved in sports or recreation activities outside of school.
  • 54% children in the middle-income are involved in sports or recreation activities outside of school.
  • 38% families in the lowest income bracket participate in sports or recreation activities outside of school.

Arts

  • 59% children in the highest income in arts activities outside of school.
  • 32% children in the lowest income families participate in arts activities outside of school.

The patterns are not isolated to Toronto. Noted social commentator Robert Putnam explains, “Kids coming from upper middle-class backgrounds are living in a different world now from kids coming from working-class or less well-off backgrounds.”

However, the second part of the survey was more heartening. When parents were asked about their child’s experiences in school, the differences, by income group, were much smaller, showing only a percentage point or two difference around such things as feeling safe or welcome in the school. This area is an improvement from the 2008 census, a period in which the school board has worked to make improvements.

Opportunity. It’s a powerful idea, that everyone should have an equal chance, that every child should have an equal start. It underscores our sense of civic sense of fairness. Now, as ever, our school system must face this challenge outside its doors too.

read more »

August 25, 2013

The Costs of Raising a Child: Bargain, Regular or Luxury

Like the debates over the poverty line, the current debate over the cost of raising a child has caused a stir. (How can you not factor in housing and childcare in these latest calculations? Bargain-shopping, seems to be the reply.)

In a previous job, I was once asked to update the Manitoba Department of Agriculture’s 2004 study on the cost of raising a child. Which child, I asked? The one that went to the local library in the summer because it was free, the one that went to day-camp, or the one that went to overnight-camp? I couldn’t do it.

Kids, it seems, come in bargain, retail and luxury versions. So, following on the concrete examples offered by academics like Peggy MacIntosh for how race affects privilege, here are some contrasts for children. Assign the costs yourself.

Category Bargain Retail Luxury
Housing Apartment Semi-detached in city or House in suburbs Detached downtown (and country escape) or House in country
Sleeping arrangements Bunk beds Double bed King-sized bed
Transport to (high) school Walk Bus pass Drive
School lunch Bread & butter 7 Grain bread & meat / cheese Prepared hot lunch
Tutoring After school (detention) Local university student Professional tutor
Childcare Neighbour / Family / Stay home Childcare centre, preferably licensed Nannies
Summer vacation Visit to family (again) Cottage (again) Europe (again)
Summer camp Community agency with field trips to local park Skills / Interest-based camp (Circus, Science, Video Games, etc.) Overnight “Away” camp, one month plus.
Home computer Anything 5 years old; no printer Personal Computer (shared desktop) Mac Computer (own laptop)
Outside play area Sidewalk Backyard Tennis club
Birthday present New clothes New toys New electronics
Dishwasher Family member Maytag Maid
Laundry Laundromat Kenmore Maid
High school failure Drop-out Alternative high school Prep school
Crooked teeth So? Braces, but only for one sibling Invisible braces
School supply shopping Dollar Store Staples Apple store
Birthday party Home, with games Party Room (bowling, play gym, etc.) Home (with bowling, bouncy castle, pony, clown, etc.)

Lots more examples to think of, no?

read more »

May 30, 2010

An agreed-upon description of poverty

When older women on the Isle of Mann were polled as to whether dressing gowns are a basic life necessity, their agreement was nearly unanimous. If someone who couldn’t afford a housecoat, they were poor. However when young men were asked the same question, their response unsurprisingly was almost the mirror opposite. À chaque son goût?

Defining poverty is a difficult task for government statisticians and policy wonks, never mind the rest of us.

Two of the best thinkers on the topic, Richard Shillington and John Stapleton, recently published a Metcalf Foundation-funded paper, Cutting through the Fog: Why is it so hard to make sense of poverty measures? In clear language, they explain how some basic assumptions shape how poverty is defined in Canada. Therefore, because each definition of poverty leads to different policy resolutions, the authors conclude that, without an agreed upon definition of poverty line, Canadians will continue to be stymied in our actions to solve poverty.

Over the course of the past two years, taking a leaf from the British and European work on social exclusion, Toronto’s Daily Bread Food Bank took a stab at improving our income-based definitions of poverty. Together with Caledon Institute for Social Policy, they built an Ontario Deprivation Index, and then, piloted it with Statistics Canada through the Labour Force Survey.

The new index developed a common list of ten items which are most likely to distinguish the poor from the non-poor. The work now stands as a key part of the Ontario government’s Poverty Reduction Strategy. The first provincial report was released last December and found that one in eight children live in a deprived situation. By its own reports, the government is committed to lowering this number.

The Ontario Deprivation Index will let us know if we have made a difference.

read more »

October 8, 2009

The Ontario HST: a counter-intuitive remedy?

The Ontario-based 25-in-5 Network for Poverty Reduction met in the basement of a community agency this week to hear some radical news. U of T’s Ernie Lightman and Andy Mitchell were at the front of the room. Economist Hugh Mackenzie had joined them. Policy wonk John Stapleton came in soon afterwards. Various funders, networks and advocacy groups sat around the room. Now Magazine’s Alice Klein sat at the side.

Lightman explained that this was a preliminary discussion rather than an off-the-record one.

We were there to discuss the Harmonized Sales Tax (HST). Despite the hue and cry against it, Mitchell and Lightman’s analysis was showing that it is a progressive tax.

When the HST was announced, Lightman, habituated by a long history watching the Department of Finance and Treasury Board, was an early critic. Soon after he was interviewed one morning on CBC radio, Finance Minister Dwight Duncan followed with his own rebuttal: university professors shouldn’t speak about things they didn’t know about, Duncan said.

Lightman, to his credit, took up Duncan’s challenge. He and Mitchell, a stats master, met with Treasury Board staff, gathered some data and began the number-crunching. The preliminary results have induced them to rethink their original position and to broaden the discussion to this audience.

Mitchell’s analysis looked at the announced changes to the HST, personal income tax and Ontario Tax Credits and their combined effect on economic families (which includes singles too). The calculations did not include the transitional “bribe”. Here’s what they found:

  • While the overall effect on families is a wash, the HST’s impact is progressive. On average, low income families will benefit from the changes; middle income earners will come out neutral; and, high earners, over $100,000, will see an increase in their total tax burden.
  • Single parents should, on average, do better under the HST, whatever income bracket they are.
  • Couples with children should also do better with the HST. (Families with children will likely do even better than projected because of point-of-sale exemptions on items such as books and children’s clothing.
  • Singles who earn under $50,000 – $60,000 should benefit from the changes.
  • Only seniors showed a more mixed result, probably because of a range of reasons.

Now, Mitchell and Lightman cautioned this was a projection using SPSM Stats Can data. It does not account for any changes in spending habits which may occur after the changes are brought in. So, for instance, if a consumer decides to a get a haircut less frequently because of the higher costs, then these numbers may shift.

As the gathered group began to thresh through what this meant, a few obvious advocacy positions emerged.

  1. If low income people are to face higher day-to-day costs through the HST, the tax credits will have to be paid more frequently throughout the year so that, as Voices from the Street Mike Creek, reminded us, they didn’t run out of money even earlier in the month. Small, regular payments are better than a few large lump sums paid months apart.
  2. Because more tax credits and income benefits will now be flowing through the tax system, community-based tax clinics will continue to be a vital means of ensuring low-income people are filing returns so that they can benefit from the credits they deserve. Community agencies will need additional resources to improve the take-up.
  3. As the changes are currently structured, young income-earners are more likely to come out better. The impact of these changes on seniors, particularly low-income ones, should be looked at more carefully to ensure they are not left behind.
  4. Ontario tax credits are now fully indexed and so are protected from inflationary erosion. They are however always be vulnerable to a government’s whim to move to partial or zero indexing. Full indexation is vital.

Hugh Mackenzie had the final part of the discussion, framing the importance of taxes because they boost “the robust fiscal capacity of government which allows government to drive services.” And, if services are boosted, as his work with Richard Shillington last spring in A Quiet Bargain showed, the poor were more likely to receive an equitable share. When it’s implemented, this “tax-grabbing” change introduced by the Ontario Liberal government may just raise enough millions and billions to do that.

The HST sounds like a good deal to anti-poverty activists, after all.

read more »

July 18, 2009

Mapping jail and university admissions

The results are in from the stellar Toronto Star team again. This week-end, they released two sets of maps, in many ways the obverse of each other:

The latter map is the result of a court order, as described in a previous post and a strong contribution to  the argument for place-based interventions. Our thanks to them.

The maps looking at university admissions also support the work being done by the Toronto District School Board’s researchers who have mapped university applications and other academic indicators by neighbourhood.

These unsettling maps lay how applicants to one of the most prestigious universities in Canada live in different worlds than the the places where people are being jailed. Opportunities are literally mapped out.

The co-incidental (?) and simultaneous release of maps is evocative of the statistic that, in many American inner cities, there are more young men in jail than in college or university.

I’ll look at more of the details in these maps in another post.

July 1, 2009

Toronto swimming pools: Class in session

One of the strongest arguments put forward to save the school pools in the TDSB has been the issue of equitable access to a public resource. Or as the headline on the Globe and Mail article by Margaret Atwood put it, without pools, “Rich kids swim. Poor kids sink.

Critics have groused because swimming pools seem a unjustified demand on the public purse for a perk which many school boards outside Toronto do not enjoy.

However, the argument goes, school pools allow students who don’t have access to summer cottages and camp to learn a basic survival skills.

It’s a debating point that has held some sway. Last week, the TDSB voted to save twenty pools, and to put 13 more on hold while the schools look for further support. Seven pools will be closed. [Declaration of potential conflict of interest: A pool will be closing at a high school which my son will be attending next year.]

Given the relentless cuts over the years, the news came as somewhat of a relief.

A closer look, though, at the pools which have been saved gives some credence to the “pools as perks for the already privileged” argument.

The list of saved pools (Forest Hill, Lawrence Park and Humberside, among others) are in some of the toniest parts of Toronto. Similarly, the list of closing pools (Bickford Centre, Central Commerce and Parkdale among others) are in poorer neighbourhoods. Such anecdotal evidence requires a closer examination.

Using these schools’ ranks on the TDSB’s Learning Opportunity Index lets us see who has won this fight. The Learning Opportunity Index uses student-level data to rank schools according to their socioeconomic bracket. The Stats Can taxfiler data measures include the percentage of students below the Low Income Measure and the percentage of families on social assistance. The higher on the Index a school is, the more rich student population is.

A rough analysis, breaking the schools into upper, middle and lower tiers shows that schools in richer neighbourhoods are the ones being saved.

Of the 20 pools which have been saved:

  • 12 [60%] of the school pools (8 high schools and 4 elementary pools) are in the top third of the LOI (i.e. the schools with the richest students)
  • 6 [30%] of the saved pools are in “middle-class” high schools, and
  • 2 [10%] of the pools which will remain open, in high schools, are in the bottom third (the neediest schools).

Comparatively, looking at the 20 pools that are still threatened or being closed, poorer schools fared worse:

  • 2 elementary school in the upper tier have a pool being put on hold.
  • 8 pools in middle tier schoolsface a threat
    • 4 closed;
    • 4 threatened (3 high schools + 1 elementary)
  • 10 pools in the poorest tier are under threat
    • 3 closed (2 high schools + Bickford Centre);
    • 7 threatened (5 high schools + 2 elementary)

Troubling, indeed.

The sample skews in favour of schools in more well-heeled neighbourhoods, but this may be a result of a “sampling error.” Perhaps more of the  pools are simply located in richer schools and so, by saving them, more “rich pools” will be saved.

So, there’s another way to examine this.

Let’s look at the number of pools saved against the number of pools threatened in each of these three income tiers. If these numbers are disproportionate then we may have evidence of a systemic problem of classism.

Sadly, these numbers tell the same biased story.

  • In the top tier, 14 pools were threatened. 12 are being saved, or six-sevenths of them (86%).
  • In the middle tier of schools, 14 pools were threatened. 7 of them are being saved (or half).
  • In the bottom tier, the poorest schools, 2 pools have been saved of the threatened 11  + the unranked Bickford Centre for Adult Students & Continuing Education. (So one in six or 17% of these pools which serve poorer students has been saved.)

Also worth noting is that the only 4 pools in elementary schools which are being saved are all in the top bracket.  However, two “top tier” elementary school have been put on hold, as have six other elementary schools, all in the middle or bottom tier.

It’s a pretty damning picture. “Higher class” pools are five times as likely to be saved as pools in the poorest schools and twice as likely to be saved as pools in the middle tier.

How can this be so?

Part of the way this has fallen out may well be because one of the key criteria used to determine whether a pool would be saved, that is whether it could “generate sufficient revenue to offset operating costs.” Pools which serve richer populations are probably more likely to be able to do so. It was a sound decision — without the further vetting needed to assure it was an equitable one.

There’s no maliciousness here, but no one asked the question, so we have created further inequalities along class lines.

If our public education system is to meet its stated ideal of leveling the playing field for all students, another look at this decision must be taken. Rich kids are swimming, and the poor ones aren’t.

For list of school pools and their status, see more.

read more »

May 28, 2009

The strength of EDI as a predictive tool

I am probably about to commit heresy: I hate the EDI.

The EDI, in long form the Early Development Instrument, has gained popularity as a population tool to rank students’ readiness for school. Developed by Dan Offord and Magdelena Janus at McMaster University, and popularized by Clyde Hertzman at the University of British Columbia, the EDI has been shown to have a strong correlation to the likelihood of a student cohort to achieve academically. But more tellingly, it strongly correlates to students’ socioeconomic backgrounds and the neighbourhoods where they live.

The EDI tool is administered in Senior Kindergarten by classroom teachers in the space of about fifteen minutes per student. To quote, students are assessed on five domains:

  • Physical Health and Well-being referring to physical readiness for the school day, physical independence, and gross and fine motor skills.
  • Social Knowledge and Competence referring to overall social competence, responsibility and respect, approaches to learning and readiness to explore new things.
  • Emotional Health and Maturity referring to prosocial and helping behaviours, anxious and fearful behaviour, aggressive behaviour and hyperactivity and inattention.
  • Language and Cognitive Development referring to basic and advanced literacy skills, interest in literacy/numeracy and memory, and basic numeracy skills.
  • Communication Skills & General Knowledge referring to the child’s ability to communicate needs and idea effectively and interest in the surrounding world.

In each of these domains, children who come from tougher economic circumstances or from outside the dominant linguistic or ethnoracial group are invariably disadvantaged. For instance, whether a child arrives to school with appropriate clothing, can discuss an idea, or knows her way around a picture book are all EDI measures. Low EDI scores are often, though not always, evidence of deprivation.

Children who start from further behind also face a higher hurdle, if they are to measure up to their peers. A different framework would  measure the improvements children may have made; instead the EDI uses a threshold to measure a child’s readiness for school. You make the cut-off or you’re at-risk.

The strengths that marginalized students might bring to the classroom, but which fall outside the scope of the the framework for “school readiness,” are also not recognized in the same weighty way. Internal resiliency in the face of a strange school setting doesn’t get measured.

(My favourite example of this was when the girl from across the street who spoke English as a second language began kindergarten with my daughter, she relied on my daughter to repeat the teacher’s instructions slowly. Then, in the afternoon, when they both attended Heritage language classes, they reversed roles. It was a creative coping strategy.)

Finally, I hate the the EDI because it can act as a proxy for teachers’ middle class prejudices and ethnocultural biases. However, therein also lies its strength.

Not surprisingly, groups of students who do poorly in academic rankings in Kindergarten generally continue to do poorly in the eyes of their teachers in higher grades. Teachers are at least consistent.

Like Robert Fulgham’s Kindergarten Poem, all your school really needs to know is how you did in kindergarten. If your Kindergarten teacher thought you were unruly and inattentive, then probably so will subsequent ones.

Research has shown that the EDI is a reliable predictor of children’s likelihood of completing school successfully. We can tell that early on who might not make it.

The EDI’s predictive ability is sad confirmation of the social gap that some identifiable demographic groups come from further behind and stay behind throughout their schooling.

Yet, there is hope. Hertzman’s work, with the school system in British Columbia, shows that a coordinated, community-based response can make a difference in the school readiness of all children. So, that is where our work begins.

May 5, 2009

A white resident’s dilemma: gentrification or segregation?

A Twitter friend, @JessieNYC, a smart and progressive woman who lives in New York City, worried recently about the selection of her new home. She had two choices: to live on the Upper East Side, a high income and mainly white neighbourhood, or to move to another apartment in East Harlem. Her choice was essentially to remain, isolated, in a white enclave or to become a gentrifier.

Gentrification is an issue about which I think a lot, but have hesitated to write about specifically because this is so personally about my neighbourhood. However another Twitter user I follow recently posted a link to Life, Inc., a searing analysis of gentrification and racial politics in Brooklyn, New York. So I have decided to take the plunge; these are things that have to be debated.

For the past fifteen years, my neighbourhood has been changing.

Renters have been displaced as homes are converted to single family dwellings. Front-yard vegetable gardens are being replaced by granite rock and Japanese maples. Median income is rising. The occupational classes of my neighbours have been changing. Where I used to live next to taxi drivers, railway conductors, sales clerks, hotel maids and medical secretaries, I now live among a range of fashion, acting, film and visual artists and writers, and professionals such as social workers, librarians, teachers, and museum curators.

And the neighbourhood is now less racially diverse. Where my (mixed-race) children could see their Chinese heritage reflected around them, where they learned to greet older adults as Po-po or Gong-gong, many of these families have moved away, almost always to be replaced by a young, white couple and a large dog, pleased to be able to afford to enter the housing market on their two incomes. One of the kindergarten teachers at the school where my kids, now in high school, attended, was surprised to realize this year that every child in her morning class is white. When my children were young, she had less than a handful of student who were white.

When I whined about these demographic shifts, a Facebook friend called me out. “Tough living where others want to live, isn’t it?” he said.

Even Jane Jacobs defended gentrification, saying this “unslumming” showed the desirability of a neighbourhood and improved the neighbourhood.

Others have admonished: Change happens!

So I have struggled to articulate my discomfort with these changes.

They are threefold:

  1. The economic drivers of the change
  2. The racial impacts of gentrification
  3. The homogenization of the neighbourhood

1. The neighbourhood change is as a result of economic forces. CUNY Professor Neil Smith provides some insight into the dynamics of these shifts (See the blog Racialicious for more). The forces underlying these moves and improvements to the the neighbourhood are economic – nay, capitalistic, rather than a reflection of social forces or personal decisions.

Smith elaborates, denying “our goal is some rigidly conceived `even development’. This would make little sense. Rather, the goal is to create socially determined patterns of differentiation and equalisation which are driven not by the logic of capital but genuine social choice.

People will maximize their return, so if that means selling out while prices are high, so they will move.  At the neighbourhood level, this plays out as high residential mobility, as prices continue to rise, and people’s price point is reached. (I remember when the first house on our street sold for over $250,000. My older neighbour crowed to me, “Diane, we’re quarter-millionaires!”). When my neighbours move away, they are having their rental housing sold from under them, or, as owners, are cashing in and moving further away, often outside the city.

These individual actions have a cumulative impact.

2. These neighbourhood changes play out racially, as well. In a city as diverse as Toronto, what plays out economically plays out racially. And because income and race are correlated here, upwardly mobile neighbourhoods are becoming whiter. Professor David Hulchanski’s work is bearing this out (see my previous post on racial divisions tracking income polarization).

The racial composition of my neighbourhood has shifted, and whites are becoming the dominant racial group here, the very opposite dynamic of what is happening demographically in the city.

3. Perhaps the most telling symptom of gentrification, is that this demographic shift is unidirectional.

Gentrification happens, in stages. And, as working class has shifted to artistic class, the upper class (and higher housing prices) cannot be far behind. The downtown city core of Toronto has become a destination.

Some of neighbours are just fine with that. Often, these same some, upon their arrival here, find the rough granularity of the neighbourhood disturbing. Often, they moved here thinking they have purchased a good bargain, just at the edge of one of the high-income neighbourhoods around us, and they mistake this neighbourhood for that one. It’s not long before they are disappointed and organizing a petition.

Or, sometimes, they thought the “colour” would be nice. And, yet, their singular arrival usually displaces an East Asian family. (Stats Can data shows one in five ethnic-Chinese people left the neighbourhood between 2001 and 2006.)The only in-migration to the neighbourhood, besides whites, are some South Asians and Urdu-speakers because the mosque and commercial district is in walking distance (Their numbers doubled, so that now they comprise 5% of the local population).

The answer to these three problems, the economic, the racial, the homogenization, is to purposefully plan for mixed neighbourhoods. Left to wider economic forces, the poor (and, by corollary, people of colour), are continually displaced.

So what to do, after all this awfulizing? Mixed neighbourhoods!

Sometimes, as discussions of mixed income neighbourhoods erupt, wealthier neighbourhoods often object to the idea of affordable housing being built in the neighbourhood. However, the response from one wise woman was, where do you want the woman who cares for your child at the daycare or serves you coffee in the morning to live? Is she a part of our community, or not?

Gentrification happens because of income inequality, an issue which is continuing to grow.  While these are issues, created at an entirely different levels, they are played out locally, within and between our neighbourhoods.

So my reply to my Twitter friend’s dilemma was, whether she stayed within the white enclave where she lives, or moves to a more diverse neighbourhood, I knew she would work to build an inclusive place. It’s the only fair thing to be done.

More:

Income polarization tracking racial divisions

“Are there limits to gentrification? Evidence from Vancouver”

Mixed picture on mixed income: Moving in on poor neighbourhoods


March 30, 2009

What is Middle Class?

The coupon clippers at Red Flag Deals had a year long debate, worthy of a sociology class, on the definition of middle class. In an extended thread, they hashed out appropriate income ranges, lifestyles and purchasing power.

It’s one of the harder questions to answer in a country like Canada where most of us see ourselves as middle class.

The “middle class” are receiving a lot of focus these days as the economy worsens. So who are we?

Earlier this week, on TVO’s The Agenda, economist Armine Yalnizyan laid out what a middle class family in Canada looks like. It lined up fairly closely to the Red:

  • You own a home, rather than rent it – this has a significant effect on your ability to accumulate wealth.
  • You can save enough to send children to after-school activities and/or post-secondary education.
  • You can save enough for retirement.
  • You can take vacations occasionally.

In advance of the Good Jobs Summit last November, Jim Stanford and Hugh MacKenzie looked at what a middle class income, or living wage, would be in Toronto. Their report for the CCPA estimates that, in a two parent family with two children, each adult, working full-time, year-round, would have to earn $16.60 an hour each for a net family income of $57,400. A single parent of one child would require a similar hourly wage ($16.15). (All this casting a different light on Premier McGuinty’s recent speculation about delaying a hike in the minimum wage.)

To find out how your family income compares to most other Canadian families, take a look at the Growing Gap’s income calculator. Adjusting for family size, it allows you to see where you sit within the range of incomes in Canada.

A final note, The Economist recently reported on a study which showed that more people in the developing world are middle-class than ever before, although, it reports, researchers  wrestled with the definition of middle class as well.

March 22, 2009

Advocacy in a time of change

To commemorate the International Day for the Elimination of Discrimination, 130 community activists gathered at the  School of Public Health at the University of Toronto. The auditorium was filled with familiar faces, with familiar messages in this old, familiar place (the old Toronto School Board office). However, this time, there was change in the air.

“We can’t sit around and watch our children die anymore,” said one presenter. “The Ontario government will use the economic downturn as a reason not to act on its commitments to poverty reduction and to the Roots of Violence recommendations,if we don’t act.”

Akua Benjamin, Ryerson Social Work professor, underlined the point, that young Black men are the ones who are dying most often, and that we need to address this specifically. Too often the broader terms of racism or people of colour occlude the particular issue of anti-Black racism.

The keynote speaker was the honourable Alvin Curling, co-chair of the recent Roots of Violence report. He has been making the rounds to numerous community meetings since its release because “writing that report was just one part” of what needs to be done.

If the recommendations are to be implemented, he explained, citizens need to push the government to carry out its commitment and to develop an implementation plan with hard goals and timelines.

Curling sounded pessimistic as some of the deadlines from the fall report loom.  However, he had people laughing out loud as he described the structural problems which lay in the way of successful implementation of the Roots of Violence report.

Siloed government ministries are like the kids in a family who each have to have their own iPod. Now, he explained, they can’t use their iPod 24 hours a day, but they also cannot share, so they each go out and get one. In fact, he explained, they won’t even tell each other what they have on their playlists.

The problem is so deep, he said, that there is no way we should throw money at it “unless the government gets its act together.”

In response to a question, Curling highlighted the recommendation on mental health supports, though, noting that this was the one recommendation which had money attached to it because of the seriousness of the issue.

Curling also touched on the topic of race-based collection of statistics, recounting a story from the consultations.

“We can’t do that,” the review was told by law enforcement officials. “The Blacks [sic] don’t like us to collect that.”

“Oh no,” snapped back one of the staff. “We just don’t like what you do with them.”

Other presenters at the day:

The City of Toronto public health report,  The Unequal City (2008), which demonstrates how different health outcomes are tied to income.

Sarah Blackstock, from the Income Security Advocacy Centre, exemplified how the 25 in 5 Network has ably kept poverty reduction on the agenda. [Conflict of interest, 1st alert, I sat onthe Steering Committee for a number of months.] The Network has had to balance maintaining an authentic link to community and labour while balancing Blackberries and meetings with the Premiers’ Office and the cabinet-level Results table, now charged with implementing the poverty reduction strategy. It’s a long way from the barricaded doors of old.

Lance McCready, from OISE/UT described his work in inner city and high need schools and his participation with the People for education report on Urban and Suburban schools. [Conflict of interest, 2nd alert, I was involved in this report and P4E before that.]

Margaret Parson of the African Canadian Legal Clinic described the upcoming World Conference on Racism and her participation, with many others in the room that day, at the conference ten years ago. Parsons urged Canadian NGOs and activists to participate even if the Canadian government was choosing not to participate in anticipation of a descent into”regrettable anti-Semitism.” She concluded by reading the final version of the controversial paragraph which had sparked the furor at the 2001 World Conference, and urged participants not to allow the broader issues of racism to be so easily set aside by a government seemingly unwilling to act.

Colin Hughes gave participants the long view, describing how the unanimous (and now notorious) 1989 parliamentary motion to abolish child poverty is  nine years overdue. Yet the momentum to keep the promise has not waned through the efforts of groups like Campaign 2000. Far from defeated, Hughes kept his sense of humour, laughing about his “useless Powerpoint slides” which had lost all his labels on the graphs.

Uzma Shakir, filled out the panel, and finished with a candid and rousing summary:

  • Racism might not be healthy for us,but anti-racism is.
  • It’s not good enough to hope that by ameliorating poverty, you are ameliorating the effectsof race. Because if good jobs are created, they run the risk of becoming generic jobs, ones that reenfoce the same old power structures. And then people of colour will be right back where we started.
  • Race and marginalization are not a newcomer phenomenon. There is a long history to racism in Canada. Immigrationis being blurred with it because most newcomers are people of colour.
  • The issue of race has to be disaggregated. If you use averages, then you could put my head in the freezer and feet in the oven, and say my body temperature was average. But that wouldn’t mean that I was healthy.

The Colour of Poverty campaign convened the one day forum with anti-racist and poverty activists, entitled Social Determinants, Growing Colour-coded Inequality in Ontario , and Racial Justice – the Pathway Forward.

A few short hours the provincial government announced it was increasing the Ontario Child Tax benefit and funding for housing. “A classic case of Liberals under-promising and over-delivering,” said one participant as his Blackberry buzzed with the leak of the announcement. “They undercut us again.”

Not that many minded. (But we’ll see what the provincial budget holds.)

%d bloggers like this: