Posts tagged ‘Toronto’

October 13, 2016

Toronto’s Urban Diversity

European cities are struggling with the increasing diversity of their populations, places which historically grew out of national and ethno-cultural identities.

Divercities is a European Union funded project what is looking at how governance and civic structures can create “social cohesion, social mobility and economic performance in today’s hyper-diversified cities.” They hosted a conference in September at the University of Antwerp  with practitioners, policy-makers and academics.

Over the few days of discussion and debate, they asked some of us about what diversity looks like in our cities. Here below is what I said about Toronto, a place that people held as an ideal when we compared notes. I should have added “There is still work to be done!”

In February there will a larger concluding conference to present the wider findings.

September 10, 2013

Toronto District School Board census 2011: Unsettling picture of inequality revealed

English: Park School studentsClose to 90,000 parents, or sixty-five per cent, of elementary school parents answered the Toronto District School Board’s census sent home last fall. The results are coming out now and reveal the unequal opportunities which children of different family backgrounds enjoy. A recent TDSB research report presents a startling picture of class and racial inequality among our youngest city residents.

 As part of gaining a snapshot of its students, parents were asked to report their family’s total income. Divided into five income groups for comparison, the report shows
  • 28% families reported a family income of less than $30,000/year.
  • 21% reported $30,000 – $49,999/year.
  • 15% reported $50,000 – $74,999/year.
  • 10% reported $75,000 – $99,999/year.
  • 26% reported $100,000+.

When this data was broken down by each family’s racial background, the differences became even more unsettling:

Bar graph showing self-reported family income of school board students by racial background.

TDSB research report on 2011 census of parents with children in Kindergarten through Grade Six.

The impact of these different family income levels was also reflected, as would be expected, in the out-of-school experience of children. Parents in each income group were asked about their children’s extra-curricular and pre-school activities.

Consistently, income was tied to children’s experiences outside of school. The following presents some of these marked differences. (Although the Board’s analysis covers all five income groups, figures for the lowest, middle and highest income groups are reported here as the pattern remains the same across each category.)

Child care centre (before Kindergarten)

  • 25% children in lowest income families enrolled their child in a child care centre.
  • 29% children in the middle-income families enrolled their child in a child care centre.
  • 45% children in highest income families enrolled their child in a child care centre.

Pre-school program

  • 25% children in lowest income families attended a pre-school program.
  • 34% children in the middle-income families attended a pre-school program.
  • 56% children in highest income families attended a pre-school program.

Sense of safety on their street or in their neighbourhood

  • 80% parents in lowest income group said their child is safe on their street or in their neighbourhood.
  • 90% parents in the middle-income group said their child is safe on their street or in their neighbourhood.
  • 95% parents in highest income group said their child is safe on their street or in their neighbourhood.

Sports & Recreation

  • 64/% children in the highest income families are involved in sports or recreation activities outside of school.
  • 54% children in the middle-income are involved in sports or recreation activities outside of school.
  • 38% families in the lowest income bracket participate in sports or recreation activities outside of school.

Arts

  • 59% children in the highest income in arts activities outside of school.
  • 32% children in the lowest income families participate in arts activities outside of school.

The patterns are not isolated to Toronto. Noted social commentator Robert Putnam explains, “Kids coming from upper middle-class backgrounds are living in a different world now from kids coming from working-class or less well-off backgrounds.”

However, the second part of the survey was more heartening. When parents were asked about their child’s experiences in school, the differences, by income group, were much smaller, showing only a percentage point or two difference around such things as feeling safe or welcome in the school. This area is an improvement from the 2008 census, a period in which the school board has worked to make improvements.

Opportunity. It’s a powerful idea, that everyone should have an equal chance, that every child should have an equal start. It underscores our sense of civic sense of fairness. Now, as ever, our school system must face this challenge outside its doors too.

read more »

February 1, 2013

Immigrant settlement in urban areas: The importance of city governments

Cities that do integration well, do well, argues a new report, From Policy to Practice: Lessons from Local Leadership on Immigrant Integration.Immigration lines

Given the timing of the impending adoption of the City’s of Toronto’s new immigration strategy, the Toronto Newcomer Initiative (a report with many graphics and colourful pictures), I thought it timely to look at what other substantive work is being done.

Where the academic-driven Welcoming Community Initiative is looking at settlement issues across the province, Cities of Migration has focused strengthening knowledge translation in urban areas across Europe and North America. Its most recent report is a series of paper from various researchers and foundations (including Toronto’s own Myer Siemiatycki). The authors provide numerous examples of how cities in the West are becoming more inclusive.

The authors start with the idea that cities have “a traditional role as places of integration.” They call for a focus on:

Integration as a complex process

  • Increased local and international mobility is the new norm.
  • Migration is often a circular process, with people, capital and cultural exchange moving back and forth across borders.
  • Policy at each level of government can make the environment more or less welcoming.
  • Non-profits and other civic organizations are instrumental in these settlement processes.

The geography of settlement

  • Newcomers move to cities but settle in neighbourhoods. Activities tend to be locally focused, so welcome initiatives should be too.
  • Newcomers are also less likely to be setting in the downtown core of major cities, but are living in their suburbs or smaller, secondary cities.

The centrality of economic integration

  • Cities are welcoming the entrepreneurial activities of newcomers, providing support, networking, etc.
  • Opening up labour market opportunities is key, through targeted employment assistance and business start-up assistance.
  • “Living wage” is being recognized as an important policy commitment at the municipal level.

The key role of municipal government

  • Cities have a role as employers and as funders to enhance economic opportunity for newcomers.
  • Cities have a role in planning and zoning by-laws, fostering business opportunities and new cultural/faith spaces.
  • City space creates opportunities for exchange and interaction, so that strangers can become neighbours.
  • City programming, through libraries, parks, and recreation, can promote immigrant integration.
  • City governments have a role in procurement to create economic opportunities for newcomers.
  • City governments have an important role in building civic engagement opportunities, including voting, identity cards, etc.

Improvements, they note, help multiple groups. Youth, for instance, are as likely to benefit from these initiatives as newcomers.

Among the report’s recommendations are fourteen for municipal governments. Here’s the top 6 (my selection):
1.       Encourage the mayor to become a public champion for immigrant integration.
2.       Ensure immigrants, including non-citizens, can participate in the democratic process.
3.       Lead by example and set the new standard for inclusive hiring practices.
4.       Target initiatives to multiple demographic groups with similar needs and experiences.
5.       Rely on good, longitudinal data to measure and target programs and services.
6.       Recognize that your city is competing for immigrants.

read more »

June 25, 2012

Student graduation rates in the TDSB showing improvement across the board

Research staff at the Toronto District School Board (TDSB) are producing a series of fact sheets to give an early peek at some of their drop-out data, and, as elsewhere, it’s good news: Student graduation rates are up.

Of the more than sixteen thousand students who started grade nine five years ago, 79% had graduated, up 10% from a comparator group seven years earlier. Those doing a “victory lap” held pretty well steady at 7%, so the decrease was in the number of students dropping out, down to 14% of the group in this study from a high of 23% in the earlier cohort.

However, while the groups examined are all showing an increase, not all groups of students are performing as well as each other. These research snapshots show some the differences among student performance within the system.

Board staff were also, for the first time, able to link these students profiles to the student census data.

Further analysis and more reports will be produced over the coming months, looking at issues like special education, race and ethnicity, and sex. This first brush looked at a wide range of variables: academic level, gender, age in grade nine, sexual orientation, racial background, language, and region of birth.

The numbers are more confirming than surprising. Eighty-eight percent of academic stream students graduated on time, compared to 59% of applied-level students. Girls had higher graduation rates than boys (83% vs. 75%).

Straight students had an on-time graduation rate of 82% compared to self-identified LGBTQ2S students of 69%.

Students who spoke English as a first language had a below-average graduation rate. Students who speak Chinese, Hindi, Serbian, and Bengali had the highest on-time graduation rates. Those who speak Spanish or Somali had the lowest rates.

The racial categories showed similar variation, but are less reliable because factors such as poverty or parental level of education were not controlled for. However, the numbers confirm that schools are not graduating Black or Latin American students in the same proportion as other racial groups.

The third fact sheet shows similar patterns when looking at the students choices around post-secondary education. 2005 and 2006 were the first years that a majority of TDSB students applied to post-secondary education on-time (the researchers measured rates of application from 17-year-olds).

The most interesting findings in this third fact sheet confirm how parental occupation and education levels seem to be major drivers in students going to university. 65% of students with parents in professional occupations confirmed an Ontario university after graduation, while only 46% of those with parents in “skilled clerical” occupations and 38% of those in unskilled occupations. These numbers are almost mirrored when looking at parental levels of education.

English: Missouri S&T Students at Fall'08 conv...

Students at Fall’08 convocation (Photo credit: Wikipedia)

Similarly, while one out of eight (14%) of students from professional families chose not to apply to university, one-third of students from unskilled/clerical families chose not to.The pattern for college applications did not show such stark contrasts.

TDSB staff plan to continue to release these early glimpses into the student and parent census over the course of the next school year.

Next up for release is a report on Special Education and how socio-economic demographics interplay with those identifications. Subsequent reports will look at student engagement; LGBTQ students; Aboriginal students; the Black student diaspora (with York’s Professor Carl James); and at continuing education (52% of the current cohort have taken at least one summer school or night school class).

May 28, 2012

Toronto maps: An incomplete index of interactive maps on the internet

Web-based mapping is fun, interactive and informative. Toronto has a great share of web 2.0 maps to enjoy.

Graphic representation of data is one of the best ways the internet has changed the way we access information. Geographic information specialists, like the amazing and proliferative Patrick Cain, are now welcoming non-experts into the fold (with Google maps and open source programs), and a wonderful range of maps about our city has emerged. Most are point-level data, the locations of places. Some are more complex. A few are quite strange.

But they’re worth a wander – feel free to share ones you’ve found!

Alcohol (retailers), Beerhunter

Alcoholics Anonymous meetings, AA Toronto

Animal rescues (domestic & wild), Toronto Star

Artists, Neighbourhood Arts Network, Toronto Arts Foundation

Baby Names, OpenFile

Backyard sharing, Growing for Green

Bed bugs, Bed Bug Registry (self-reports)

Bed Bug reports, Patrick Cain, Toronto Star

Bike routes & accident rates, Toronto Open File

Business Improvement Areas

Capital construction (planned), City of Toronto

Car ownership, Patrick Cain, Toronto Star

Catholic schools, Toronto Catholic District School Board

Census 2011: Population, Pop. growth, Density, CBC (select Toronto)

Census 2011: Demographics, Global News (drop-down list, opens to Mother Tongue)

City Wards, City of Toronto

Child Care locator, City of Toronto

Commercial Kitchens (versus Community Kitchens), Food Forward & Housing Services Corporation

Community meeting space

Community gardens, Toronto Community Garden Network

Community legal clinics, Settlement.org

Convictions for sale of tobacco to minors,Toronto Public Health

Crime, per capita, by neighbourhood & type, CBC

Criminal Charges, 2010 Toronto Star

Cycling

Culture (okay, this one is Mississauga)

Demographics (This is a cheat – it’s the City’s Wellbeing site)

Dog breeds, Global Toronto

Doorings, Doored.ca (map at bottom of page)

Donation boxes (charities)

“Eater Heat” (popular restaurants)

Farmers’ Markets, Toronto Farmers’ Market Network

Free Meals programs, Toronto Meals Programs

Free Parking

Food Premises Inspections, City of Toronto

Grow-ops, Global

Gun ownership, Toronto Star

Health, Toronto Community Health Profiles (another cheat – static, but comprehensive)

Heat vulnerability, Toronto Public Health

Heritage plaques

High Rise Construction, The Grid, 2011

Historical businesses and institutions, 2014

Historical photos, Blog TO, 2011

Home price increases, Macleans, 2014

Homicides: 2012, 2011, Victims since 1990, Toronto Star

Hot Dog/Street Vendors, Canada.com

Housing Assistance, Settlement.org

Immigration history, Toronto Star

Kisses

Little Free Libraries, Little Free Library.org

Military recruiting, Toronto Star

Neighbourhoods (administrative), City of Toronto

Neighbourhoods, Tourism Toronto

Neighbourhoods (self-organized), Toronto Star

Neighbourly-minded neighbours, 5 Blocks Out

Non-Profits, by Ontario riding boundaries, Ontario Non-Profit Network

Ontario wines at local farmers’ markets, Ontario.ca

Open Plaques, “Museum of the Streets”

Parking (Green P), City

Parking ticket hotspots, Global

Problems with municipal services, The Fixer, The Toronto Star

Public Art

Public Libraries

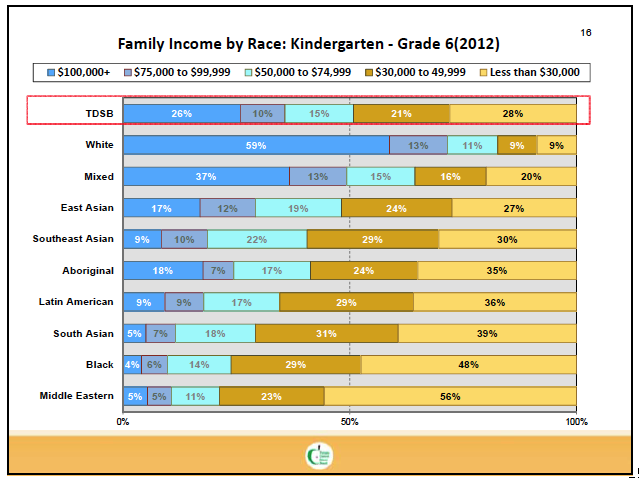
Public schools, TDSB

Public transit

Road Restrictions

Residents’ Associations & Neighbourhood groups, Dave Topping

Rental housing (Craigslist & Kijiji)

Running routes

School Suspensions & Expulsions for Drugs and/or Violence (TDSB data: CTV News)

Service Ontario Kiosk or Centre, Government of Ontario

Settlement Services, Settlement.org

Smells

Smoking, Toronto Star

Smoking Violations/Sales to Minors, City of Toronto

Spice City reviews of “ethnic” restaurants

Street Map (Open Street Map wiki)

Subway playlist (The Stationary Grove), MAP Communications Consulting

Sweets & treats, Yummy Baguette

Tech Start-ups, #madeinYYZ

Towing (where your car gets taken)

Trees, Matthew Brown

United Way Toronto member agencies

University of Toronto

Walking intersections (highest volume), Openfile

Walkscore (including Bikescore)

Waterfront

Watertesting, lead (Toronto Star)

Wellbeing, City of Toronto

Working Poor, Globe & Mail, Metcalf Foundation report, 2012

Zoning, City of Toronto

January 9, 2012

New Stats Can study: Youth crime patterns in Toronto neighbourhoods

I once showed a map of Toronto’s 2005 summer of shootings to a sociologist at the University of Hawaii and, without ever having visited our city, she was able to point out the main commercial districts, transit lines and low-income areas. These are the areas where urban crime cluster, she explained.

English: The northwest corner of the intersect...

Perhaps easily apparent, the patterns are always more interesting at a more granular level of detail.  So a new Statistics Canada report from the Crime and Justice Research Paper Series. has again given Torontonians another glimpse into criminal activity in our city. This time, author Mathieu Charron has focused on youth crime in Toronto. (His earlier 2009 paper on Toronto looked at broader patterns of crime.)

About 175,000 youth, aged 12 — 17, lived in the City of Toronto in 2006, the year which Charron used for his analysis. Using census tracts as a proxy for neighbourhoods, Charron looks at the geographic distribution of youth crime, and the characteristics of the places associated with it. He maps all police-reported incidents which involve a youth.

As anticipated, his maps show concentrations of youth crime along transit lines, in commercial areas, and then less frequently, around schools. But the study also finds some other interesting and confirming patterns:

  • About 1/3 of reported youth crime occurs in outdoors public spaces, and another third in commercial establishments. School properties accounted for the location of 12% of other reported incidents (2/3 occurring during supervised school activities). Public areas and local residences surrounding schools do not necessarily experience more youth crime, although local businesses do.
  • Neighbourhoods with lower mobility (i.e. residents more likely to have lived there for five years or more) experience less crime. Charron suggests more stable social networks may be part of the explanation for this.  And, as shown in other studies, neighbourhoods with higher levels of immigration are also less likely to experience some forms of youth crime. Family cohesion is usually seen as a contributing factor.
  • Neighbourhoods with more access to resources also are less likely to see youth accused of crime.
  • Central Toronto neighbourhoods (i.e. easily accessible) are more likely to experience youth crime in public areas.
  • Youth are more likely to be accused of a crime when they live in neighbourhoods with high adult crime rates, or higher residential mobility (people move homes more frequently) or where residents are economically vulnerable (low-income areas). Here, Charron cites other studies which attribute low levels of social control and/or exposure to violence as important contributing factors.
  • The characteristics of a youth’s home neighbourhood are more likely to predict whether youth become involved with the criminal justice system than the locations of where crimes take place. (Does that mean there are bad neighbourhoods? No, just vulnerable ones, with fewer resources.) This may be related to another of the study’s findings, that youth are more likely commit crimes outside their own residential neighbourhoods.

The most frequent sites of youth crime in 2006 were in commercial establishments, largely because of high traffic and opportunity. Property crime, especially shoplifting, accounted for 3 ⁄ 4 of the reported incidents. The maps Charron includes appear to confirm concentrations around shopping malls. The biggest apparent hotspot was Scarborough Town Centre with more than 250 incidents per square kilometre. Other crime hotspots (east to west) appear to be Yorkdale Shopping Mall, Dufferin Mall. Eaton Centre, Laird/Eglinton or Thorncliffe area, Cedarbrae Mall and Malvern Town Centre. These all showed rates between fifty to two hundred and fifty reported incidents. Outside of these large commercial centres, Charron found neighbourhood establishments, such as convenience stores and restaurants, were also vulnerable. Charron found a strong overlap between commercial areas which reported youth crime and adult crime, although youth were more likely to be involved in outlying neighbourhoods in the city.

In his next area of focus, outdoor public spaces, Charron found the prevalence of youth crime was much smaller, by a dimension of 25 to one (The upper range of outdoor events was only 10 incidences per square kilometre). As our Honolulu sociologist predicted, reported incidents were concentrated along transit and subway lines, in lower-income areas and near commercial areas. Charron also found some support for the “bored teenager syndrome,” that the number of reported crimes were higher in neighbourhoods with a higher number of youth, including central areas of the city where youth tend to gather and where household incomes are higher. Subway and other natural gathering points also attracted higher crime levels. The highest areas, reporting more than ten incidents per square kilometre, were around the University of Toronto, the Yonge Street downtown south of Yonge, Yonge and Finch, around Donlands and Danforth and the surrounding area (where five high schools are concentrated). Smaller problem pockets were found at Jane, south of Finch, the Mount Dennis area, Mount Pleasant and Eglinton (another high school), Pape Village, Greenwood Park, Kennedy subway station and its environs, and the Kingston Road and Morningside area.

The final location Charron examined are crimes which were reported to have happened in private residences. Largely concentrated in neighbourhoods with average employment incomes below $50,000 ⁄ year, the geographic pattern mimicked that of outdoor crime, especially outside the central part of the city. Charron found that crimes which occurred in houses were more likely to be property crimes, such as breaking and entering, theft and mischief. Crimes which occurred in apartments and other dwelling units were more likely to be violent offences. Residential crime was less likely to occur where there was a higher proportion of recent Canadian immigrants, where there are fewer youth or lower adult crime, or where local residents have access to more resources.

Charron concludes though by saying that neighbourhood characteristics, such as economic vulnerability, have less of an effect on youth crime than they do on adult crime — perhaps speaking to the early resiliency of youth.

More up-to-date data on crime in the city can be found through the Toronto Police Services Crime Statistics site and the City of Toronto’s Wellbeing Indices.
October 27, 2011

Pros & cons of collecting demographic data to improve educational equity for students

On Monday, more than sixty school board staff and community members from Ottawa and the GTA area gathered at York University for a roundtable on the topic of student demographic data and educational equity.

Sponsored by the Knowledge Network for Applied Education Research, the project hopes to corral the various ways boards are using non-academic data about students to better serve their academic needs. It’s a topic that is difficult to summarize within an afternoon’s work, however Peel region’s Paul Favaro set the stage, highlighting many key challenges.

These questions are complex on multiple levels, however, we cannot be frozen into inaction, Favaro said. The meeting organizers, Professor Carl James, others, and Favaro urged the group to move through these challenges to ensure all students are offered equitable opportunities.

When 40% of the variance in student achievement can be explained by factors external the classroom and school, we need to understand the pathways and mechanisms that are at play here, Favaro said. It is a question of grounded in fundamental principles, he said.

If we agree all students deserve the best educational opportunities regardless of their backgrounds and that large inequalities exist both within and outside the classroom walls, what is the benefit of collecting data which tracks students according to socio-economic class, race, sex, or other such grounds?

Favaro detailed the some of the positive and negative aspects of collecting student demographic data.

Benefits include:

  • Assessing which groups are vulnerable and are underperforming / under-served
  • Programming better targeted
  • Able to monitor and assess improvements / accountability
  • Encourages the fulfillment of each student’s potential
  • Moves closer to providing an educational system that is free of bias
  • Increases achievement in society and among vulnerable groups
Drawbacks however were also noted:
  • May (re-)produce reduced sense of academic competence, becoming a self-fulfilling prophecy.
  • Members of vulnerable groups may feel stigmatized
  • May increase prejudicial attitudes and stereotyping if critical analysis not used
  • May lead teachers to implicitly or subconsciously teach students from some groups below their actual potential
  • Added pressure on members of high-performing groups
  • Contributes to labelling & false homogenizing
  • May be used by those in dominant positions to keep vulnerable minorities down
  • Potential backlash from parents & community members from high achieving groups [preserving their rank]

Another barrier to building a stronger evidence base identified by the attendees is the unwillingness of school administrators, teachers, parents and the general public to explore these uncomfortable issues, because, as one attendee described it, we risked a loss of our “Canadian innocence,” our self-image of being a fair place.

Former B.C. Deputy Minister Charles Ungerleider gave closing remarks, identifying the need for national participation in the creation of these solutions. He is writing a paper for the Canadian Education Association on the topic to which we can look forward by the end of the year.


read more »

June 29, 2011

Wellbeing Toronto

Long awaited, Wellbeing Toronto is launching this morning through the City of Toronto website.

Keep hitting refresh! It will be here soon.

The Toronto Star has given a sneak peek in today’s edition. The site lets users select and map , across the City’s 140 social planning neighbourhoods, from a menu of indicators, ranging from one of Toronto’s top ten languages, applications to universities, or robberies. It also maps locations of various civic sites, community hubs, rate payers associations and other neighbourhood features.

While it’s bound to have some bugs as it launches (I couldn’t see a legend), this is a significant contribution to the civic dialogue of the city – as long as more than real estate agents use it! (My conflict-of-interest? I sat in on two advisory panels during its development.)

read more »

June 23, 2011

New, more open data sharing on Toronto websites

English: Map of Toronto Français : Carte de To...

English: Map of Toronto Français : Carte de Toronto Deutsch: Karte von Toronto (Photo credit: Wikipedia)


Toronto data geeks can be excited about three new websites breaking onto the Toronto scene.

The first is a fresh new look for Toronto Health Profiles, a data partnership among St. Michael’s Hospital’s Centre for Research on Inner City Health, Toronto Public Health, the Wellesley Institute and some community organizations. Thematic maps and data tables on a range of health indicators are being released as they are being developed. The site has gotten a good overhaul to make it easier to navigate and give it a cleaner look.

The second, from the Three Cities project, which looked at changing income trends in Toronto neighbourhoods, is releasing its findings in new more useable formats. The research website, driven by St. Christopher House and University of Toronto Professor David Hulchanski, Neighbourhood Change has re-launched with a new look. The site offers additional maps, a recent report on Scarborough and video clips. Information on Montreal and Vancouver are included alongside tower renewal in the Greater Golden Horseshoe.

The third and most elaborate, the Wellbeing Toronto website will be launching June 29. (The site is so new, the URL was still being determined at the beginning of June!) It evolved out of the Neighbourhood Wellbeing Index/Indices project through the City of Toronto.

This new interactive site will build on census data and local administrative databases (liberated through Open Data Toronto). It has been funded through the Citizenship Immigration Canada Toronto Newcomer Initiative. The available data will be aggregated to the level of the city’s 140 planning neighbourhoods.

The site offers a range of goodies, from orthographic/satellite, cartographic/street view maps of Toronto. Ward boundaries and places of interest, such as community stores or convenience stores, will be mappable. An address search function is also to be included.

The developers have tried to make the site user-friendly, including some pre-set domains, including, for instance, a “diversity index” which measures ethno-racial mixes within a neighbourhood. Users of the site will be able to drill down into neighbourhoods or make comparisons among them. Up to 20 indicators can be loaded at a time, weighted differently, and then the data can be able to be exported to PDF, Excel or CSV formats.

The crime data is likely to be the most popular area of inquiry. Data for criminal code offenses for seven major crimes are included: Murders, Shootings, Vehicular theft, Break and Enters, Assaults, Sexual Assaults, and Arson. All of this rich fodder that has only been available on a limited basis up till now.

City staff are also looking to include other data in the future. Approaches to the Toronto Board of Trade, the Local Health Integration Networks (LHINs, for information on hospitalization rates and seniors), the Canadian Bankers Association (for information on debt load), and the Children’s Aids Societies.  Indicators for arts and culture will be coming in October. The Toronto Transit Commission should also be included because  of the open data work, looking at routes, stops, crowding.

Both these sites will help to better inform civic discussions in the city and so are welcome web 2.0 resources.

read more »

April 28, 2011

Community Hubs in Toronto

Charles, Prince of Wales outside the White Hou...

Image via Wikipedia

Last summer, Prince Charles announced the Pub is a Hub program had spread to over 400 English villages. Offering community services in the unused rooms, the program expects to save the institution of the hub and alleviate some of the needs of rural communities.

HRH explained,

The key is to identify what is needed in each community and meet that need using spare rooms or land at the local pub, whether it is a shop, playground, meals for the elderly or even allotments [community gardens]. There are so many benefits.

Community hubs serve three important functions in neighbourhoods:

  1. Services: A wide range to meet local need, providing wrap-a-round to a client’s multiple needs.
  2. Space: An accessible, neutral place for local residents
  3. Synergy: A critical mass of services which improves access and delivery to residents, and which creates the opportunity to strengthen social networks

It’s what neighbourhood centres have known and practiced for a long time: Respond to local need, build community.

Jane Jacobs (another timely reference with Jane’s Walks days away), explained that community hubs are

always where there’s a crossing or a convergence. You can’t stop a hub from developing in such a place. You can’t make it develop if you don’t have such a place.

In Toronto, community hubs are popping up in schools, in strip malls, street corners and libraries. The City government has incubators for business, fashion and food;United Way Toronto has thirteen in development or launched; the Toronto District School Board is launching Full Use Schools alongside its broader Community Use of Schools initiative; and community groups ranging from Artscape creating community art spaces to church congregations looking for new uses for old buildings are exploring the concept of creating neighbourhood spaces.

This week, the Intergovernmental Committee on Economic and Labour Force Development (ICE Committee) released a summary report  and profiles I wrote cataloguing these many initiatives. It’s just an overview but should create the opportunity for more discussions.

read more »

%d bloggers like this: