September 10, 2013

Toronto District School Board census 2011: Unsettling picture of inequality revealed

English: Park School students
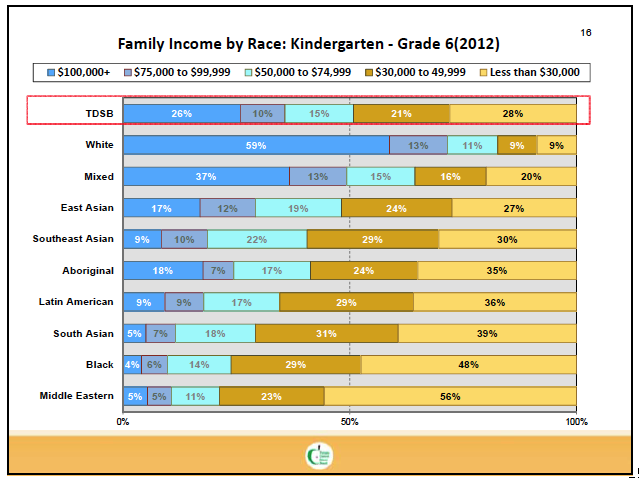
Close to 90,000 parents, or sixty-five per cent, of elementary school parents answered the Toronto District School Board’s census sent home last fall. The results are coming out now and reveal the unequal opportunities which children of different family backgrounds enjoy. A recent TDSB research report presents a startling picture of class and racial inequality among our youngest city residents.

 As part of gaining a snapshot of its students, parents were asked to report their family’s total income. Divided into five income groups for comparison, the report shows
  • 28% families reported a family income of less than $30,000/year.
  • 21% reported $30,000 – $49,999/year.
  • 15% reported $50,000 – $74,999/year.
  • 10% reported $75,000 – $99,999/year.
  • 26% reported $100,000+.

When this data was broken down by each family’s racial background, the differences became even more unsettling:

Bar graph showing self-reported family income of school board students by racial background.

TDSB research report on 2011 census of parents with children in Kindergarten through Grade Six.

The impact of these different family income levels was also reflected, as would be expected, in the out-of-school experience of children. Parents in each income group were asked about their children’s extra-curricular and pre-school activities.

Consistently, income was tied to children’s experiences outside of school. The following presents some of these marked differences. (Although the Board’s analysis covers all five income groups, figures for the lowest, middle and highest income groups are reported here as the pattern remains the same across each category.)

Child care centre (before Kindergarten)

  • 25% children in lowest income families enrolled their child in a child care centre.
  • 29% children in the middle-income families enrolled their child in a child care centre.
  • 45% children in highest income families enrolled their child in a child care centre.

Pre-school program

  • 25% children in lowest income families attended a pre-school program.
  • 34% children in the middle-income families attended a pre-school program.
  • 56% children in highest income families attended a pre-school program.

Sense of safety on their street or in their neighbourhood

  • 80% parents in lowest income group said their child is safe on their street or in their neighbourhood.
  • 90% parents in the middle-income group said their child is safe on their street or in their neighbourhood.
  • 95% parents in highest income group said their child is safe on their street or in their neighbourhood.

Sports & Recreation

  • 64/% children in the highest income families are involved in sports or recreation activities outside of school.
  • 54% children in the middle-income are involved in sports or recreation activities outside of school.
  • 38% families in the lowest income bracket participate in sports or recreation activities outside of school.

Arts

  • 59% children in the highest income in arts activities outside of school.
  • 32% children in the lowest income families participate in arts activities outside of school.

The patterns are not isolated to Toronto. Noted social commentator Robert Putnam explains, “Kids coming from upper middle-class backgrounds are living in a different world now from kids coming from working-class or less well-off backgrounds.”

However, the second part of the survey was more heartening. When parents were asked about their child’s experiences in school, the differences, by income group, were much smaller, showing only a percentage point or two difference around such things as feeling safe or welcome in the school. This area is an improvement from the 2008 census, a period in which the school board has worked to make improvements.

Opportunity. It’s a powerful idea, that everyone should have an equal chance, that every child should have an equal start. It underscores our sense of civic sense of fairness. Now, as ever, our school system must face this challenge outside its doors too.

Continue reading

August 25, 2013

The Costs of Raising a Child: Bargain, Regular or Luxury

Like the debates over the poverty line, the current debate over the cost of raising a child has caused a stir. (How can you not factor in housing and childcare in these latest calculations? Bargain-shopping, seems to be the reply.)

In a previous job, I was once asked to update the Manitoba Department of Agriculture’s 2004 study on the cost of raising a child. Which child, I asked? The one that went to the local library in the summer because it was free, the one that went to day-camp, or the one that went to overnight-camp? I couldn’t do it.

Kids, it seems, come in bargain, retail and luxury versions. So, following on the concrete examples offered by academics like Peggy MacIntosh for how race affects privilege, here are some contrasts for children. Assign the costs yourself.

Category Bargain Retail Luxury
Housing Apartment Semi-detached in city or House in suburbs Detached downtown (and country escape) or House in country
Sleeping arrangements Bunk beds Double bed King-sized bed
Transport to (high) school Walk Bus pass Drive
School lunch Bread & butter 7 Grain bread & meat / cheese Prepared hot lunch
Tutoring After school (detention) Local university student Professional tutor
Childcare Neighbour / Family / Stay home Childcare centre, preferably licensed Nannies
Summer vacation Visit to family (again) Cottage (again) Europe (again)
Summer camp Community agency with field trips to local park Skills / Interest-based camp (Circus, Science, Video Games, etc.) Overnight “Away” camp, one month plus.
Home computer Anything 5 years old; no printer Personal Computer (shared desktop) Mac Computer (own laptop)
Outside play area Sidewalk Backyard Tennis club
Birthday present New clothes New toys New electronics
Dishwasher Family member Maytag Maid
Laundry Laundromat Kenmore Maid
High school failure Drop-out Alternative high school Prep school
Crooked teeth So? Braces, but only for one sibling Invisible braces
School supply shopping Dollar Store Staples Apple store
Birthday party Home, with games Party Room (bowling, play gym, etc.) Home (with bowling, bouncy castle, pony, clown, etc.)

Lots more examples to think of, no?

Continue reading

June 5, 2013

TDSB Census 2011 highlights student isolation

The most recent TDSB census of parents and students shows improvements where the school board has influence, such as including students’ experience, welcoming parents into schools, or creating an environment where students feel safe. This part is a good news story that shows that concentrated educational efforts can make a difference.

However, as media reports have highlighted earlier, students are also feeling more stressed. The census results also show that physical health and nutrition drop in higher grades. Similarly, students are more likely to report being tired, having headaches, or being less happy in higher grades.

One-third of students don’t want to go to school, regardless of their age.

Students are also less likely to report having at least one adult whom they “feel comfortable to go to for personal support, advice or help.”
  • 34% of Grade 7/8 and 46% of high school students said they have no adult in whom they could confide.
  • 34% of Grade 7/8 and 31% of high school students said they had one adult in whom they could confide.
  • 31% of Grade 7/8 and 23% of high school students said they had more than one adult in whom they could confide.

Students report being less comfortable participating in class, especially those in high school.

According to the census, overwhelmingly students feel safe in class, but do report feeling less safe in other parts of the school building or outside on the grounds.

These are startling initial numbers. The impulse will be to psychologize the results, to describe the deficits in TDSB students and in their families. However, I want to suggest an alternative.

The social science of sociology might shed better light on how to support students to succeed: When students feel they belong in their schools, they will thrive. Foresightedly, some Board staff and trustees are already taking some good first steps and so have struck a working group to look more closely at the issue of how school relations shape better learning.

While the comparisons have not yet been explicitly made, this committee might start with the widening demographic gap between teacher and students. Increasingly divided by age, culture and socioeconomic class, students have a pretty good reason to feel disconnected from the adults in their schools. It’s up to the adults to fix that.

Continue reading

June 2, 2013

Community heros lifting above their weight: The story of a community hub in Hamilton

Don MacVicar once broke three world records, lifting 10 times his weight combined in a single competition. Now, he’s doing bigger things. He’s lifting a community on his shoulders.

The familiar hallways of a school now open into community resource rooms.

The familiar hallways of a school now open into community resource rooms.

For the past eight years, McVicar has led a renewal project in the industrial north end of Hamilton, Ontario, creating a hub in the  Robert Land school when it was faced with closure. Re-named the Eva Rothwell Centre, the former school now hosts a job resource centre, recreation programs, youth drop-in, summer camps, community health programs, police services (staffed by chatty volunteers, with handouts on everything from crime prevention to bed bugs), and a clothing bank.  It’s also one of the sites of Pathways to Education (the strange rumour in the community being that the tuition bursary may be abolished). There is even a miniature railroader club in the school’s basement, art out of metal, rails and wiring and a full-size railway car on delivery, to be a new literacy centre. And, yes, of course, there is a weight room.

This is, like many stories of community change, the story of heroes — how often local improvement is made by the determined efforts of a small group of people. (In fact, that Margaret Mead reference is on the home page of their website.)

When the school faced closure, MacVicar and a group of community member approached the Hamilton school board and proposed to buy it. Private donors stepped in with some quick funding to pony up close to $350,000, giving the community association time to incorporate as a non-profit corporation.

Two weeks ago, the centre hosted five bus loads of elementary students from the Toronto District School Board to attend the ribbon-cutting for a new draw: Team Canada 72 room filled with hockey memorabilia and team players.  It’s part of MacVicar’s plan to make the centre a destination where people want to visit. Next fall, he hopes to bring in the Stanley Cup.

Heroic as these efforts were, the visit to this re-purposed school highlighted two key lessons, at the micro-level and the macro-levels.

At the micro-level is the importance of taking action. Asked how he had accomplished this, MacVicar softly explained “If I join a committee, and they’re not doing anything within three months, I quietly move on.”

The second lesson, though, is broader. This good work needs to move beyond the efforts of small groups. Community hubs, such as these, should be supported at the system level because relying on local heroes to make this happen shouldn’t be a record-breaking event.

Continue reading

May 16, 2013

TDSB Census 2011 shows Toronto’s divisions and diversity

Early results from the Toronto District School Board (TDSB) 2011-2012 census of its students and parents are now being released.  Unlike Statistic Canada’s staged release of data which leaves visible minority status and income data until the final stages, TDSB researchers pushed this key data  out quickly.

The TDSB census results, from 192,000 respondents, capture two wider trends in the city of Toronto: growing ethnocultural diversity and widening income inequality.

A startling example of these divides show that race and income are dividing our city’s residents:

The majority of students who are racially White come from higher income groups; 59% of them are in the $100,000+ group and only 9% of them in the lowest income group under $30,000.

In a perfect world, White students, at 29% of the student population, should be 29% in each of the income groups. The finding underscore the sharpness of the dividing lines among us.

We hope further analysis is forthcoming, but even a look at the basic demographics of students provides interesting insights into how changing city and the shape of the school system.

Ethnoracial Diversity

In two separate questions, one multiple-choice and one write-in, parents and students were asked to identify their racial and cultural backgrounds.

The results showed students’ racial backgrounds in 2011 were:

  • 29% White
  • 24% South Asian
  • 15% East Asian
  • 12% Black
  • 9% Mixed race
  • 5% Middle Eastern
  • 4% Southeast Asian
  • 2% Latin American
  • 0.3% Aboriginal

These categories were developed in consultation with parents and community in the first census round, with an emphasis on region of origin. The 2011 results closely align to the numbers from the previous student census, thereby reflecting the stability of the survey.

The TDSB census results are an amplification of Toronto’s wider diversity. The Statistics Canada’s 2011 National Household Survey (NHS) showed doesn’t yet show such diversity.

In the NHS, only half of Torontonians identify as White, 12% identify as South Asian, and 11% identify as Chinese (TDSB also included Korean and Japanese in this category) and 9% of Torontonians identify as Black.  This difference between the TDSB census and the NHS is not surprising since Toronto’s older populations (out of school) tend to be less racially diverse.

Income

The TDSB census also explored at the issue of family income. This is an important category because of the proven correlation with academic performance — those with less, do more poorly — an important consideration for a public school system.

The income data from the TDSB census comes from two sources. Parents of students in Kindergarten through grade 6 were asked their family income. Students in Grade 7 though 12 were not expected to know their family income, so instead were asked the profession of their parents. These were divided into estimated income ranges.

According to the new TDSB census, almost half of its students come from families with incomes of less than $50,000. By comparison, in 2010, the median after-tax income for families (two or more people) in Toronto was $65,500. So a larger-than-expected number of students come from families in the lowest-income ranges.

Grade school parents reported the following incomes:

  • Less than $30,000: 28%
  • $30,000 – $49,000: 21%
  • $50,000 – $74,000: 15%
  • $75,000 – $99,000: 10%
  • $100,000+ : 26%

High school and junior high students were similar, dividing from professional through unwaged classes. (NHS data for Toronto are not yet available.)

In the end, these early census results underscore the challenge for the public school system to respond to the changes, so that all students can learn, whatever their cultural or class background.

Note: The TDSB has now published the census on its website. Global Toronto has also produced a series of topical reports from some of the results.

Continue reading

March 26, 2013

Crime & Difference: What I want to say to our new local Toronto Police superintendent

English: The neighbourhood of Danforth Village...

English: The neighbourhood of Danforth Village in Toronto, Canada, looking east down Milverton Boulevard at its intersection with Woodmount Avenue. (Photo credit: Wikipedia)

“Toronto crime” is the the top search term that lands people on my blog, a blog about neighbourhoods and how we live together in community. However, as Mazlow’s hierarchy of need describes and, as our new local police superintendent must know, safety is the basis of all else.

Crime, and the threat of it, is why we pack high school auditoriums and why we write worried letters-to-the-editor. Whether our reaction is to lock ourselves behind double-deadbolted doors or to set up Neighbourhood Watches, these  are the ways we seek to protect ourselves and that which we love.

Last summer I attended a nearby community meeting with the local crime prevention officer. The attendees, many of my better-off neighbours, fretted about activity in the back alleyways, apparent drug activity at some homes, and people with substance abuse problems wandering by on neighbourhood sidewalks. None of these made the neighbourhood very family-friendly, so this focus wasn’t unfounded.

This is a neighbourhood where a substantial number of its residents have had some involvement with the criminal justice system, and the local police station has shown that targeting the few “bad apples” can drive down crime. Combing through a map of incarcerated individuals from a 2009 Toronto Star investigation, I found this part of the east end ranked on par with a few of the city’s better-known priority neighbourhood areas (see More below).

My own son, like many of my friends’ sons, had been mugged. It’s almost a neighbourhood rite of passage, disrupted once when a group of young men broke with orthodoxy and confronted a local mother demanding she turn over cash. For my son, though, it ended well. Older boys intervened and one of them, recognizing the aggressors, talked them into returning the stolen money. (Honour among thieves, indeed! I loved this story, when I finally heard it, because of the two degrees of separation and the power of social networks and social norms.)

I sat listening for a while, sympathetic to these women, protective too of their broods.

But now my son, the teenager I love, has grown. He is taller than me with a bristly haircut, a loping walk, and arms he’ll flex at the merest provocation. He looks, admittedly, a bit scary to some. And, as a mixed-race kid, he doesn’t carry the skin privilege I do.

Were they talking about him? A few assured me afterwards they didn’t mean him, of course, that they knew he was a good kid. But that’s small comfort. He has already been stopped by the Police, and I know the police won’t be asking my neighbours to vouch for him.

So our crime prevention meeting abruptly became nerve-wracking. Suddenly we weren’t talking about criminal activity. We were talking about how people looked, or dressed, or ambled around the neighbourhood. We were ready to call the police when someone, muttering to themselves or holding “too much” cash, walked by our porch. This, in a former working class neighbourhood, still with a group home, a rooming house, public housing, and scattered supportive units for people with mental health challenges?

Were we talking about enforcement over community-building? To sanction over supports?

Perhaps if we are scared enough, I heard.

This is the nub of the challenge our new superintendent will face: the tensions that arise among those who are different from each other, among those who do not have an easy understanding of each other and a code of behaviour to smooth things over.

It will take a sharp mind and a good heart to negotiate these waters, but I’m sure she’s up for the job of catching criminals, of resolving local disputes, and, as they say, of knowing the difference between the two.

Continue reading

March 10, 2013

Gaming Toronto’s neighbourhoods

Do you know the names of Toronto 140 official neighbourhoods? Click that ‘hood tests your knowledge of officialdom, making a game of the City of Toronto’s administrative planning areas. Developed for Code for America by Matt Keoshkerian, a transplanted Torontonian, the website uses data now available through Open Toronto.

In a Google world, Click the ‘hood cleverly avoids the perennial problem of double spellings between the spelling of neighbourhood and neighborhood. The site has gamified city neighbourhoods around the world, including Montreal (20 neighbourhoods), Vancouver (23 neighbourhoods), and Saskatoon (59 neighbourhoods).

With the growth of mapping, neighbourhood names are facing a new revival. Sociologists argue the naming of a neighbourhood is an important marker of social cohesion. Condo developers know this well, too. Donmount public housing was subject to an entire re-branding when it became Rivertowne, and the neighbourhood around it as taken the name Riverside. My favourite recent example of this is the new development at the corner of Woodbine and Upper Gerrard within days of local residents voted to call their area Beach Hill, a name marketed by a local condo development.

English: Neighbourhoods in East Toronto

Most of these cities have geographic gaps, parts of the city where no common consensus has emerged on the name of the place. Even within Toronto this was a problem.

Developed about ten years ago in an effort to coordinate competing geographic descriptors across various service divisions, City of Toronto staff divided the city into 140 areas. The areas were clustered to capture similar social demographics among residents and to be similar in population size. Natural boundaries, such as ravines and railways, were used where possible. Finally, neighbourhood names were selected, without broad consultation, on historic names or local geographic features, such as street names.

Through this method, the entire city was mapped and, now, with the power of gamification, the City’s 140 administrative neighbourhoods will become more familiar to Toronto residents.

(P.S. My best time? About 80 seconds for 20 random neighbourhoods.)

Continue reading

February 1, 2013

Immigrant settlement in urban areas: The importance of city governments

Cities that do integration well, do well, argues a new report, From Policy to Practice: Lessons from Local Leadership on Immigrant Integration.Immigration lines

Given the timing of the impending adoption of the City’s of Toronto’s new immigration strategy, the Toronto Newcomer Initiative (a report with many graphics and colourful pictures), I thought it timely to look at what other substantive work is being done.

Where the academic-driven Welcoming Community Initiative is looking at settlement issues across the province, Cities of Migration has focused strengthening knowledge translation in urban areas across Europe and North America. Its most recent report is a series of paper from various researchers and foundations (including Toronto’s own Myer Siemiatycki). The authors provide numerous examples of how cities in the West are becoming more inclusive.

The authors start with the idea that cities have “a traditional role as places of integration.” They call for a focus on:

Integration as a complex process

  • Increased local and international mobility is the new norm.
  • Migration is often a circular process, with people, capital and cultural exchange moving back and forth across borders.
  • Policy at each level of government can make the environment more or less welcoming.
  • Non-profits and other civic organizations are instrumental in these settlement processes.

The geography of settlement

  • Newcomers move to cities but settle in neighbourhoods. Activities tend to be locally focused, so welcome initiatives should be too.
  • Newcomers are also less likely to be setting in the downtown core of major cities, but are living in their suburbs or smaller, secondary cities.

The centrality of economic integration

  • Cities are welcoming the entrepreneurial activities of newcomers, providing support, networking, etc.
  • Opening up labour market opportunities is key, through targeted employment assistance and business start-up assistance.
  • “Living wage” is being recognized as an important policy commitment at the municipal level.

The key role of municipal government

  • Cities have a role as employers and as funders to enhance economic opportunity for newcomers.
  • Cities have a role in planning and zoning by-laws, fostering business opportunities and new cultural/faith spaces.
  • City space creates opportunities for exchange and interaction, so that strangers can become neighbours.
  • City programming, through libraries, parks, and recreation, can promote immigrant integration.
  • City governments have a role in procurement to create economic opportunities for newcomers.
  • City governments have an important role in building civic engagement opportunities, including voting, identity cards, etc.

Improvements, they note, help multiple groups. Youth, for instance, are as likely to benefit from these initiatives as newcomers.

Among the report’s recommendations are fourteen for municipal governments. Here’s the top 6 (my selection):
1.       Encourage the mayor to become a public champion for immigrant integration.
2.       Ensure immigrants, including non-citizens, can participate in the democratic process.
3.       Lead by example and set the new standard for inclusive hiring practices.
4.       Target initiatives to multiple demographic groups with similar needs and experiences.
5.       Rely on good, longitudinal data to measure and target programs and services.
6.       Recognize that your city is competing for immigrants.

Continue reading

December 14, 2012

Research fatigue and other lessons from Toronto’s Regent Park.

“Research Park – er, I mean Regent Park…”

It was a telling slip in one resident’s lament about the degree of academic surveillance taking place in Regent Park, the low-income Toronto neighbourhood where public housing has been torn down and is being rebuilt as a mixed income community. Thousands of new condo and townhouse owners will be living alongside the original low-income tenants in the next decade.

It is a living lab, a natural social experiment that is too tempting for a city with three universities and several more within driving distance of it.

Professors, grad students and undergrad class projects have taken their toll on Regent Park residents, creating a research fatigue, just as the second and largest phase of the redevelopment at Regent Park is underway.

(See More below to see a short list of the research projects I know.)

“If another researcher knocks on my door again, I won’t be very polite when I answer it,” declared one resident.

Another long-time resident was puzzled by the attention, saying

Our neighbourhood is just like every other one. There are all kinds of people. It’s not related to income or our location. It’s just that we’re living in a fish bowl.”

However, a recent panel at University Toronto drew a packed house of academics, residents, community service providers and advocates. The interest in undeniable. Even the residents in attendance at Regent Park Research Panel: New Findings from the Field were active in the debate afterwards. The speakers, all graduate students, have spent long stretches in the community and so spoke with an authenticity generally welcomed by the audience.

Each spoke in turn on their area of study.

Ryan James, York University

Youth, Stigma, and Security in 1970s Regent Park

James, an Anthropology doctoral student with ties to the community, described a history of Childhood in Regent Park. One of the powerful points in his narrative was the vulnerability of local children and youth.

One young women explained, “Being poor almost meant that you have a target on your back for sexual predators.”

Gordon Stuckless of Maple Leaf Gardens notoriety was remembered in the community.

When the community rose up in defence of its children, a vein of  “virulent homophobia” also erupted. This died down though, James explained, when gay rights activists held counter-demonstrations protesting that homosexuality did not equal pedophilia.

Sharon Kelly, University of Toronto

Navigating the road back home: The return of Regent Park Phase I residents

The next speaker, Sharon Kelly, also a doctoral student in Anthropology, embedded herself within the project unit which managed the moves required by residents as the redevelopment occurred.

“It was a place of hope,” she explained, decorated in bright colours and with fresh flowers, where residents, assigned by random draw, pored over floor plans to choose their new units. Higher floor or lower? North, south, east or west? Early project phase or later? In Regent Park or nearby? They lingered, ranking their first, second and third choices.

However, Kelly explained the site office was also a place of distrust, where residents worried about favouritism or grew weary of delays or frustrated their choices were not available. Some of the tensions were very real. Long-time residents were upset that a random draw meant that their length of tenure was not recognized. Or families and seniors, who were not able to meet shorter moving times, sometimes lost out to others who were more nimble.

Staff were sympathetic, but argued that the lottery system ensured impartiality, especially given the difficulty of evaluating and comparing competing needs. It was emotionally draining work, Kelly explained, and staff were forced to make decisions fast in order to keep up with the construction schedule.

A swap board was created so that tenants could negotiate changes among themselves. While well-intentioned but, Kelly did not hear of any viable trades made this way. What it did offer however was a sense of control that tenants welcomed.

When asked what some of the challenges, Kelly explained the biggest issue regarding complex work of resident relocation was the deceptively simple issue of communication.  Toronto Community Housing Corporation (TCHC) was cognizant of this, she said, and, for instance, when they needed to contact residents, they knocked on doors instead of mailing letters.

The work goes on, as three more phases have to be completed.

Martine August, Planning, University of Toronto

From isolation to inclusion? Tenant experiences in Regent Park’s Phase II

The final speaker was Martine August, a doctoral student in Planning, working with Alan Walks to take a critical look at gentrification and mixed income neighbourhoods.

August began with a brief description of the development plans for Regent Park. Begun in 2002, the revitalization of the neighbourhood was set to happen in five phases through a Public Private partnership. Capital would be raised through the sale of private market, newly-built housing stock.

The first phase is now completed, and residents have returned to new homes. Once complete, only 19-20% of the housing will be Rent Geared to Income (RGI), down significantly from the original neighbourhood. While the overall number of low-income residents will stay approximately the same, as higher income people move in, their density will be decreased.

Arguments for why this is good, August explained, is that there is “presumed need to deconcentrate poor people” because they are isolated from good role models. The concentration of need, the argument goes, leads to negative outcomes; Cause and effect are being mixed, she argues. (Professor Jim Dunn’s work, see below, is also finding that the “role model” argument is based on weak evidence.)

In the public’s mind, mixed income neighbourhoods have emerged as an ideal without the supporting evidence.

At best, these arguments are offensive, August explains. At worst, it is used to justify gentrification, leading to the removal of homeless and other marginalized people. This framing re-stigmatizes poor people (in a similar way to how public housing was originally and purposefully built to be unattractive).

Discussions of renewal and mixed neighbourhoods “use the language of balance in service of exclusion,” August argues. It is an academic argument she wants to test.

To explore this further, August interviewed 32 households before they moved out (pre-phase 2) and 50 households who have moved back from phase 1.

Residents were enthusiastic about several things in Regent Park: central location, availability of services, walkablility, easy access to public transit, number of local ethnic grocery stores, parks, and places of worship.  Residents described the benefits of living downtown and the vibrancy of the neighbourhood (all themes which are part of the marketing campaign for the new condos).

Residents also described the strong social ties and community connections they had with other tenants. “This doesn’t match the story of social isolation which is told about poor neighbourhoods,” August explained. Newcomers found each other, people borrowed from each other,  kept care of each other’s children, celebrated together, were there for crisis support. Community members also were proud of their political activism, describing Regent Park as a place which hit above its weight because of the concentration of people together.

So, contrary to stereotypes, Regent Park is well-located, well-connected, well-served.

“Not that weren’t real problems,” August said. “First, being the state of repairs and maintenance of the buildings, pests, broken appliances, plaster crumbling, and poor common areas. And it’s not clear that redevelopment will improve this. Already residents are telling of problems in their units, falling glass, broken shelves, buckling floor boards. TCHC has a $6m cut to their repair budget”.

Drug activity is still reported, according to August, but the tenants tend to take the attitude that “but if you don’t bother them, then they won’t bother you.” Tenants also recognize that solving this issue is not simply a matter of getting “the bad guys out.”  Brothers and sons are swept up in the crackdown, and the problem usually just shifts to a new location.

New design and new condos haven’t stopped these old problems.

Residents also report that stigma still an issue. although many resist the stereotypes. Something as simple as clothing reinforces class divisions within the new community.

Each new condo tower has achieved higher prices than one before.

August argues that if the purpose is to solve social problems, a market driven approach may not be the best way to address the issues.

English: As part of the redevelopment of Regen...

As part of the redevelopment of Regent Park from a social housing development to mixed-income neighbourhood, four of the five apartment towers designed by Peter Dickinson are being demolished (one will be preserved for historical reasons). Constructed in 1958, the collection of Regent Park towers won a Silver Medal by the Massey Medals for Architecture in 1961. This is an image of the second tower being demolished. Toronto, Ontario, Canada. (Photo credit: Wikipedia)

However the market forces are pressing forward. The number of condos have now gone from around 3000 to 5400 without much discussion.

This will have impact on many levels, including the political presence of tenants as gentrification shifts to the local demographics to more middle-class concerns. At this point, residents associations, like RPNI (see below), represent tenants. Condo associations are also emerging. There may be opportunities to bridge among these associations.When asked, August recounted a telling story from the Don Mount (now Rivertowne) re-development across the river from Regent Park. That smaller community has also undergone a “renewal” that mixes income groups into a single housing project. Low-income tenants there report that people in market-rent housing have been really dominating community meetings, focusing on issues such as safety and policing, noise and garbage collection. Tenants feel targeted in their own neighbourhood.

When Regent Park condo owners heard about local youth being targeted by police, they organized an information session for youth, to learn their rights. This “rights-based” approach, in contrast to “keep-your-head-down” approach, highlights the very different frame of experience that middle-income and low-income people use.

The evening ended with the promise to continue the discussion, finding opportunities to bring these findings to the people of Regent Park.

“Good people live there,” one tenant said in conclusion.

Continue reading

December 2, 2012

The function and art of underground entrances: Metros, subways and the tube

Entrance to Old Street Underground station, London, England

Entrance to Old Street Underground station, London, England

On a trip through Europe, I once took a picture of some cows. “Why!?!” I wondered when I got home. “They’re cows.” My more creative sister did a bit better, producing a series on the various toilets we encountered through our travels.

My eye has sharpened just a bit now, I hope, and on my recent trip to London, England, in part for the First International Convention of Neighbourhood Bloggers, I focused on built form and urban space.

The accessibility of this subway entrance, near my hotel in the east end, caught my eye: stairs for when I was in a hurry, and a gently sloped ramp for when I was dragging my luggage. Wheeled conveyances welcome. (With over eight exits onto the Old Street roundabout, however, I did get lost.)

To confirm this strange new obsession, today’s U.K. Telegraph Travel section has published a photo series of the “most impressive underground subway stations” which looks at the artistic side of the transportation hubs.

The Moscow stations are baroque in their style, the London Underground industrial, the Scandinavian countries organic. The Italians are almost ready to unveil a subway entrance in Naples which could be described, in polite company, as a pair of lips.

Among the most playful example in the Telegraph series was this entrance to the Bockenheimer Warte metro station in Frankfurt:

Bockenheimer Warte U-Bahn
Everywhere, though, commuters look very work-a-day, bored as they make their way through these incredible spaces.

Tags:
%d bloggers like this: